Comp 401 - Senior Seminar (Spring 2023)
Introductory Information
Recommended Text
- Web Style Guide, 4th Edition, by Lynch and Horton. (Huh. Why this book??)
Other Information
- ACM's Code of Ethics
- Computing jobs statistics from the Bureau of Labor Statistics.
- Computer science students are in demand - one of many such articles.
Project Resources
- PySimpleGUI - Python GUI library. The "Call Reference" tab is especially helpful.
- PySimpleGUI Cookbook - lots of samples (recipes) using the idea of design patterns.
- Samples using PySimpleGUI.
- Pillow - documentation for Python Imaging Library (PIL).
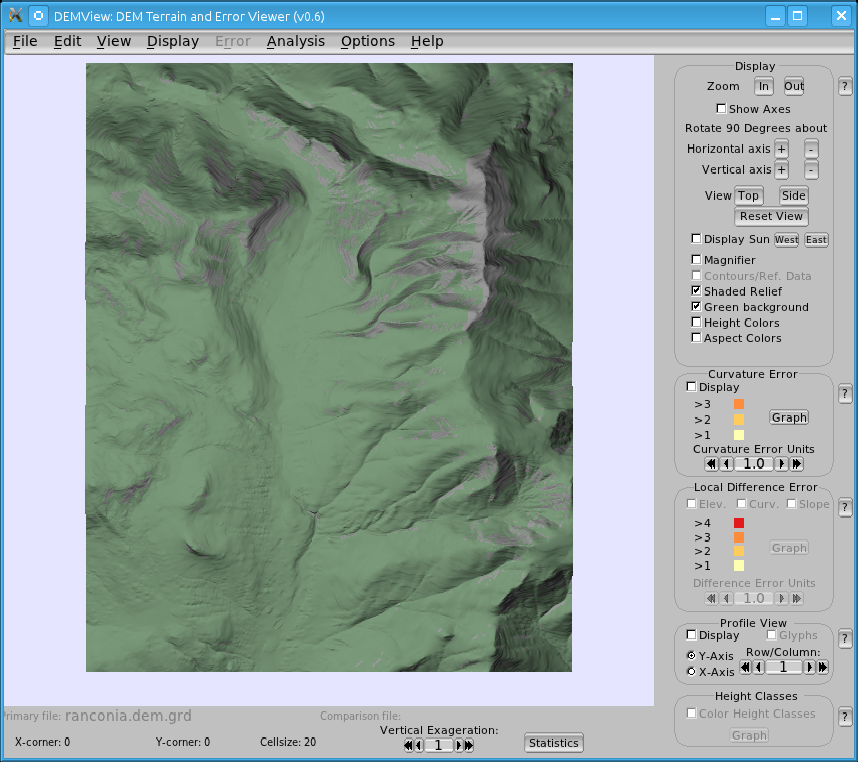
- Esri ASCII grid format - file format used for DEM/DTM files.
- Agile Manifesto
- Scrum Reference Card
- Computer Graphics concepts - useful for displaying topographic data.
- Phong lighting model
- Computer Graphics from Scratch
Projects/Papers
Research Papers
- The Cognitive Style of PowerPoint - booklet by Edward Tufte. Also available in the library.
- The Cognitive Style of PowerPoint: Slides Are Not All Evil - article by Jean-Luc Doumont. Also available through the library.
- CompSurf: An Environment for Exploring Surface Reconstruction Methods on a Grid (2003)
- Augmenting Grid-Based Contours to Improve Thin-Plate DEM Generation (2005) - journal article. Yikes.
- Constructing a DEM from Grid-based Data by Computing Intermediate Contours (2003) - shows RMSE and other statistical measures.
- The Case for 3D Visualization in DEM Assessment (2013)
- Comparisons on Scrum Team Strategies: A multi-agent Simulation. Proceedings of the 12th International Conference on Computer Modeling and Simulation (2020).
- Why do Software Teams Deviate from Scrum? Reasons and Implications. Proceedings of the International Conference on Software and System Processes (2020).
Projects
-
sem3.pdf - Sem 3 project description.
Phong shading model (Wikipedia).
Calculating normal to a plane - Wolfram Alpha. franconia.dem.grd - sample ASCII grid file of Franconia, NH.
franconiaSmall.dem.grd - edited Franconia DEM.
shaded relief map of Franconia.
bountifulpeak.usgs.grd - tiny USGS DEM of Bountiful Peak, Utah.
bountiful.maxc.interp.grd - an interpolated version of Bountiful Peak.
In-Class Examples
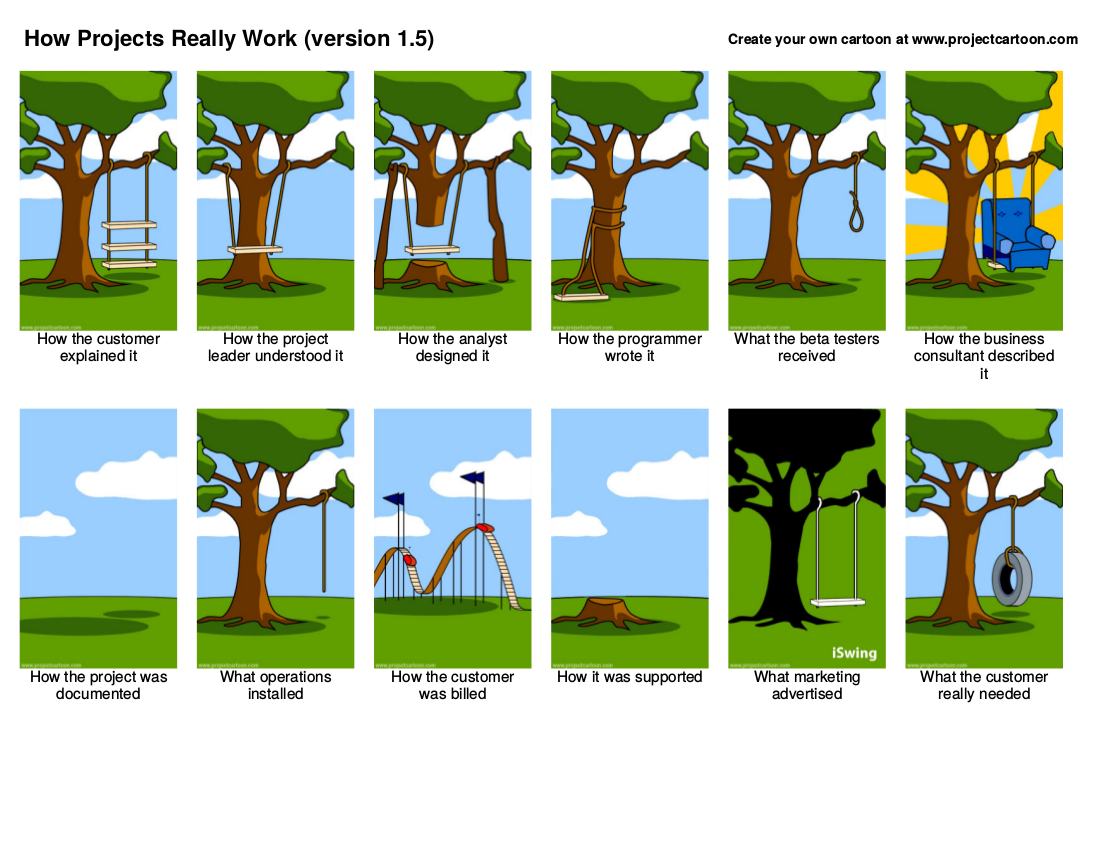
- Cartoon - software engineering.
- Cartoon II - a dig at Microsoft is always good.
- What is this ?
- Directions to Copper Mt.
- four.4.py - basic image viewer using PySimpleGUI.
- five.py - enhanced image viewer that now uses a constant size window and properly scales the images.
- invest.cpp - debugging fun!!
- funFiles.tar.gz - debugging fun!!
Fun with ChatGBT
Final Project Info
- Kite Aerial Photography - client website.
- Client slideshow.
- DFS sample 1: The Wheaton TechnoLegacy.
- DFS sample 2: Mountain Climber.
Client Questions & Answers
PowerPoint
- Good start!
- The Gettysburg Address - Peter Norvig's version of the famous speech.
- The Power of PowerPoint - says it all, doesn't it?
- E.T. Does Rocket Science - Tufte's review of the use of PowerPoint in the space shuttle disaster.
- Key slide of Columbia PowerPoint presentation.
- Math/CS Department Seminar - example of a PowerPoint presentation.
- Giving an Academic Talk - some advice about presentations, including what to show on slides, from Jonathan Shewchuck of UC Berkeley.
- Example of an Academic Talk - a typical conference talk using PowerPoint, but Doug Zongker. Here is the paper that goes along with the talk.
Career Preparation
- virtual.cpp
- hlist.cpp
- Copy constructor
- Copy constructor solution
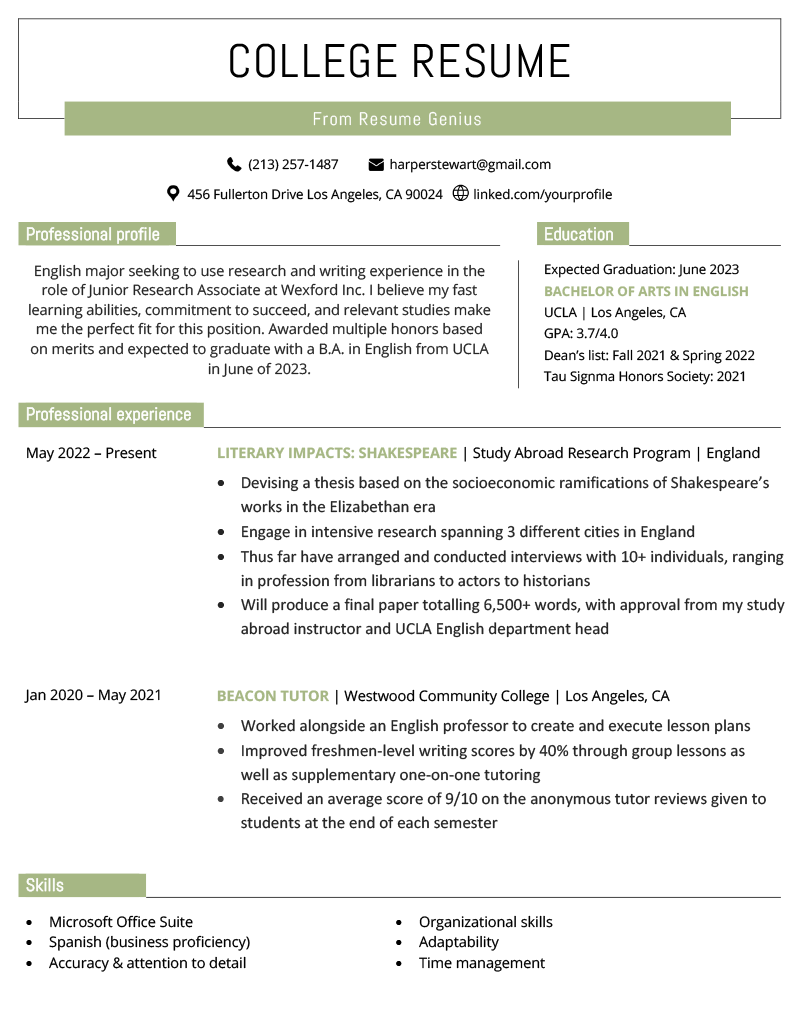
- College resume?
- Resume 1
- Resume 2
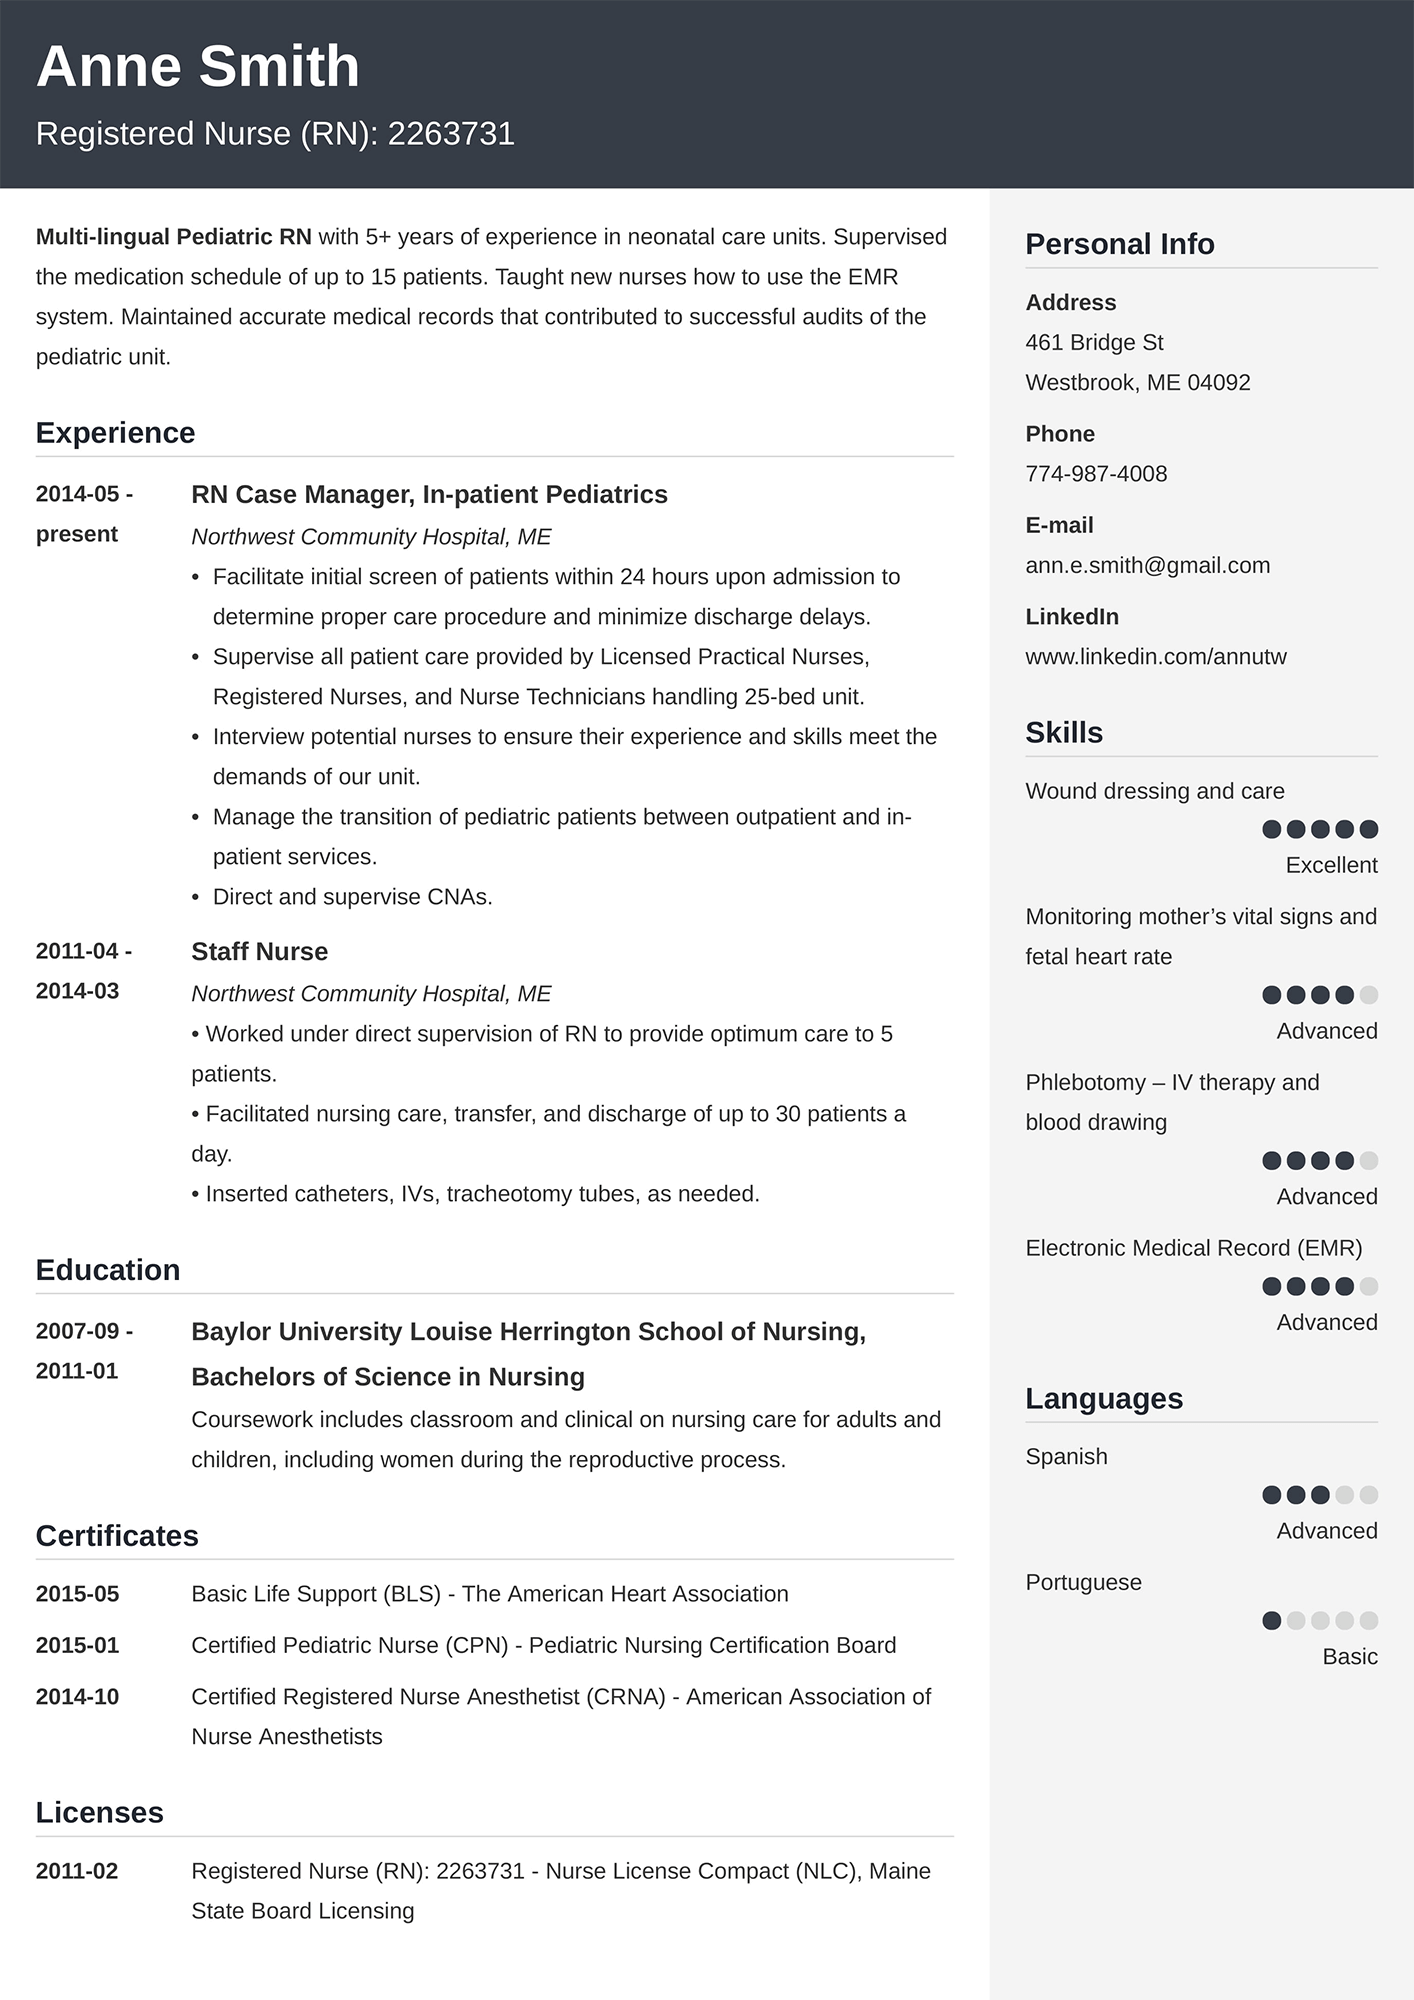
- Nurse resume (??)
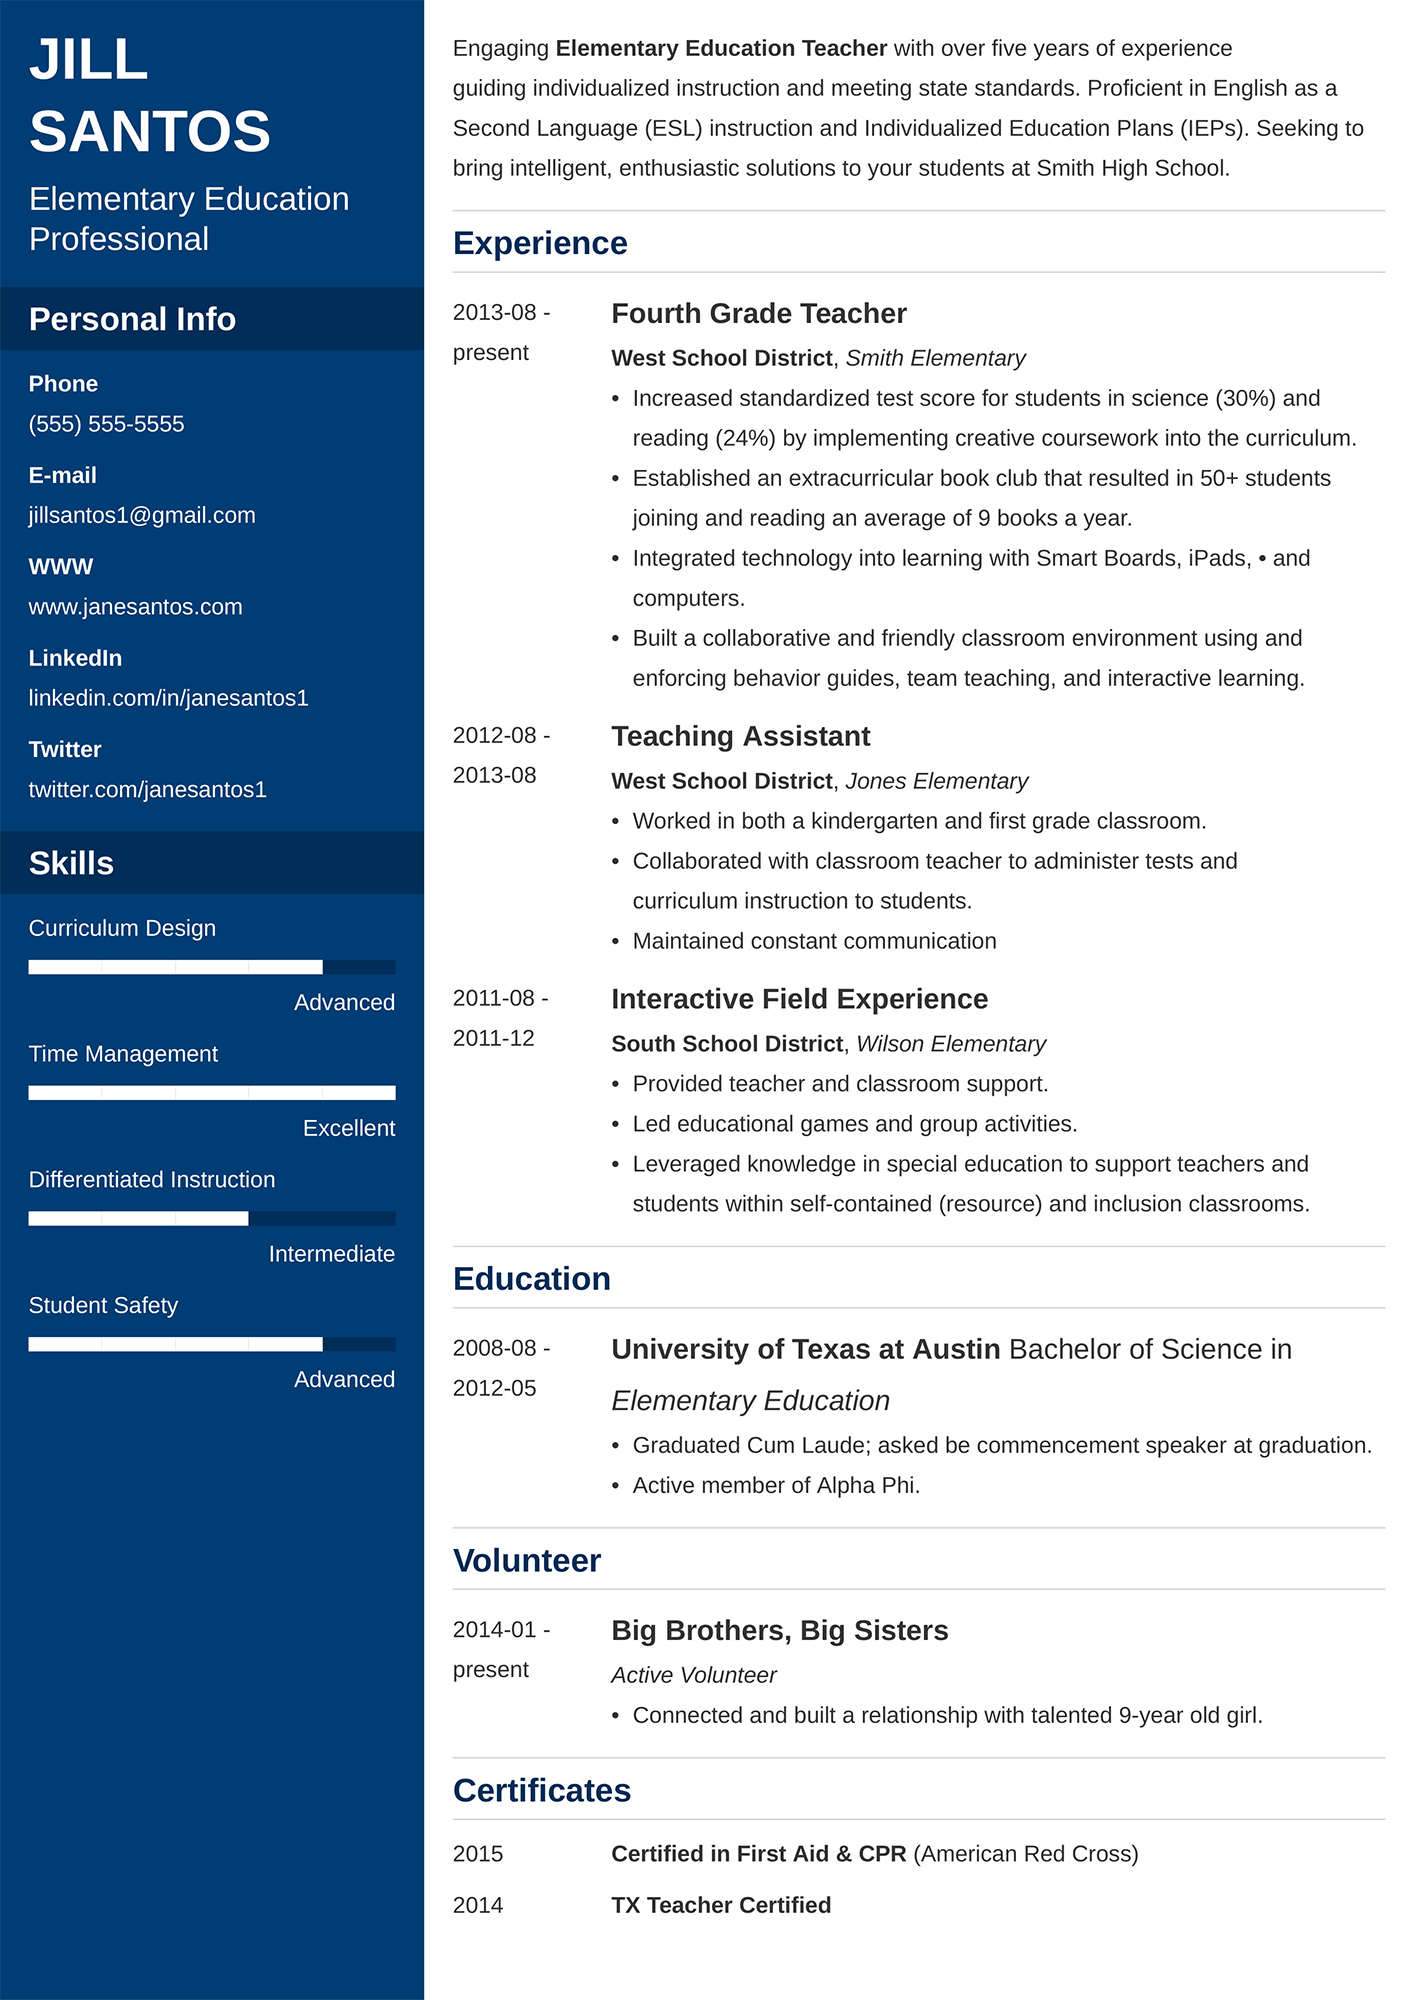
- Teacher resume
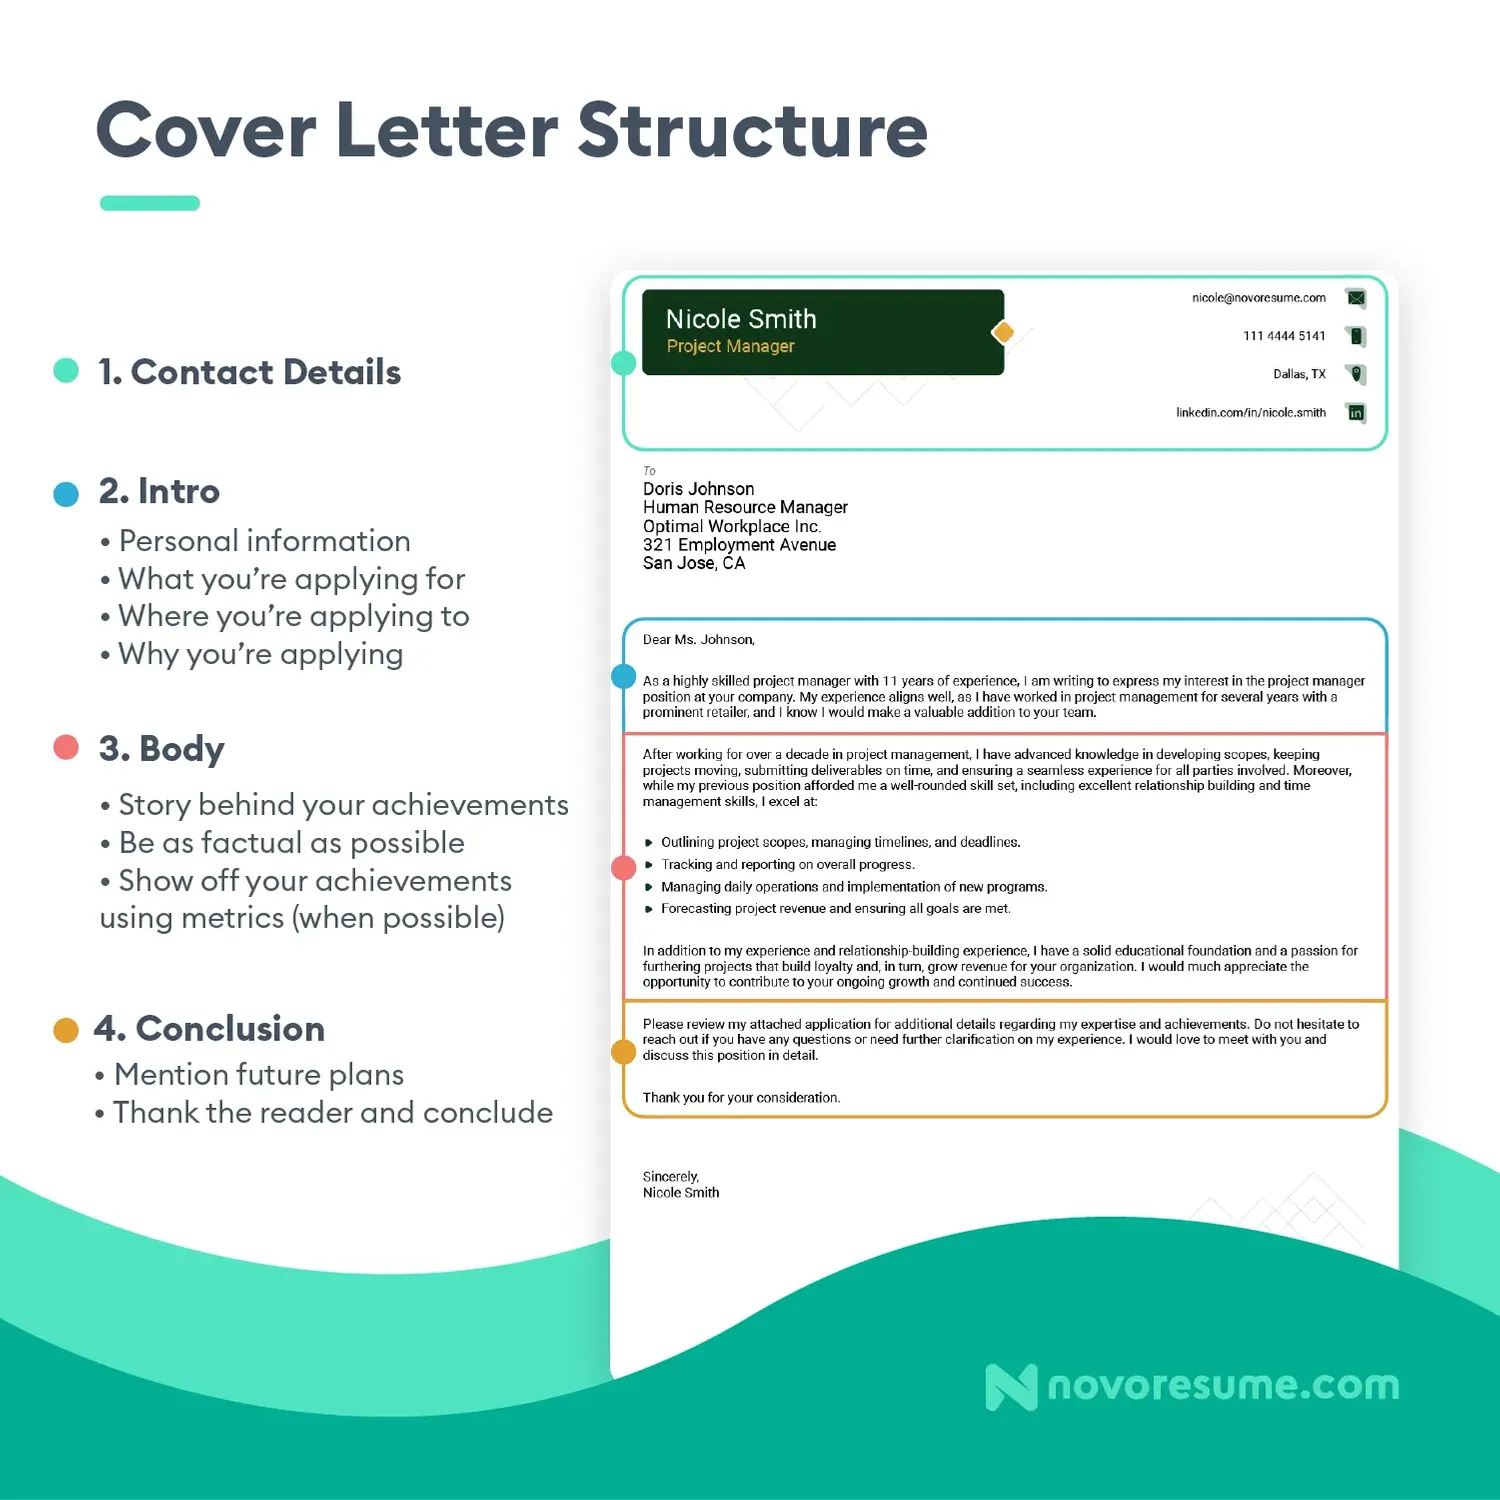
- Cover letter basics
- Cover 1
- Cover 2
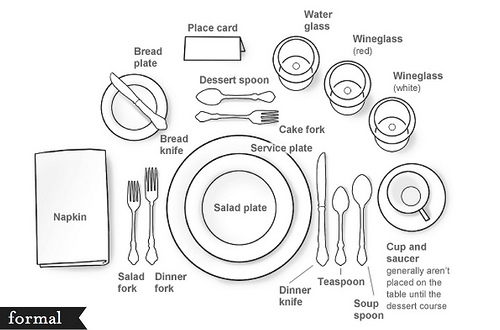
- Place setting
- The Great Napkin Controversy: What to do with a napkin?? Two opinions:
- Dining etiquette- from a certified etiquette school (wow, this exists!); also includes some other dining tips.
- Napkin etiquette- from Emily Post, famous in the etiquette world.