
Research
My research includes areas in Computational Geometry, Geographic Information Systems (GIS), Computer Graphics, and Visualization. The main areas currently under investigation are:
- Data Visualization - my current focus is on clustering and visualizing top ten data over
time. Examples include
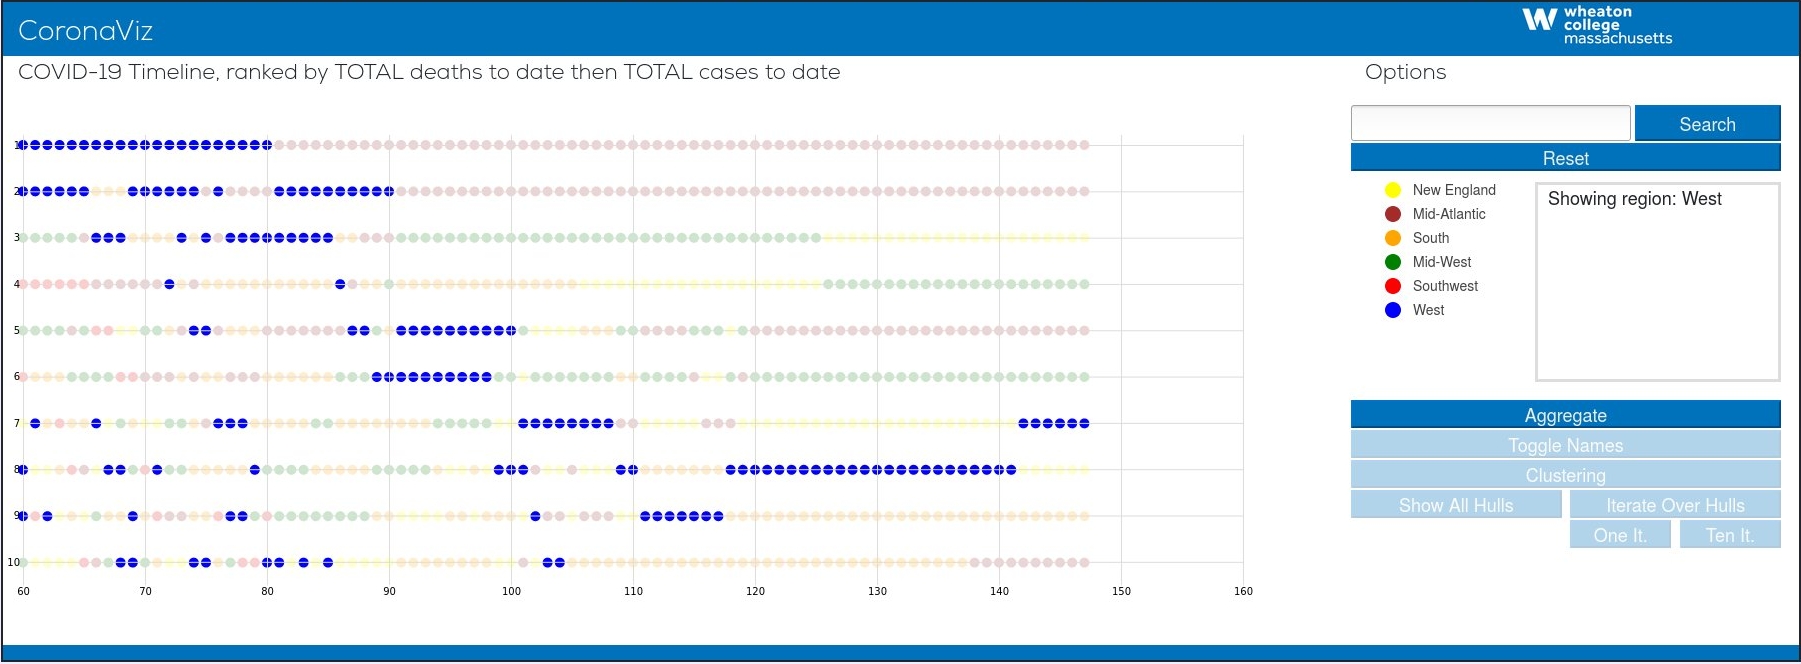
CoronaViz which shows deaths and cases as a result of COVID-19.
The system was initially created as visualizing
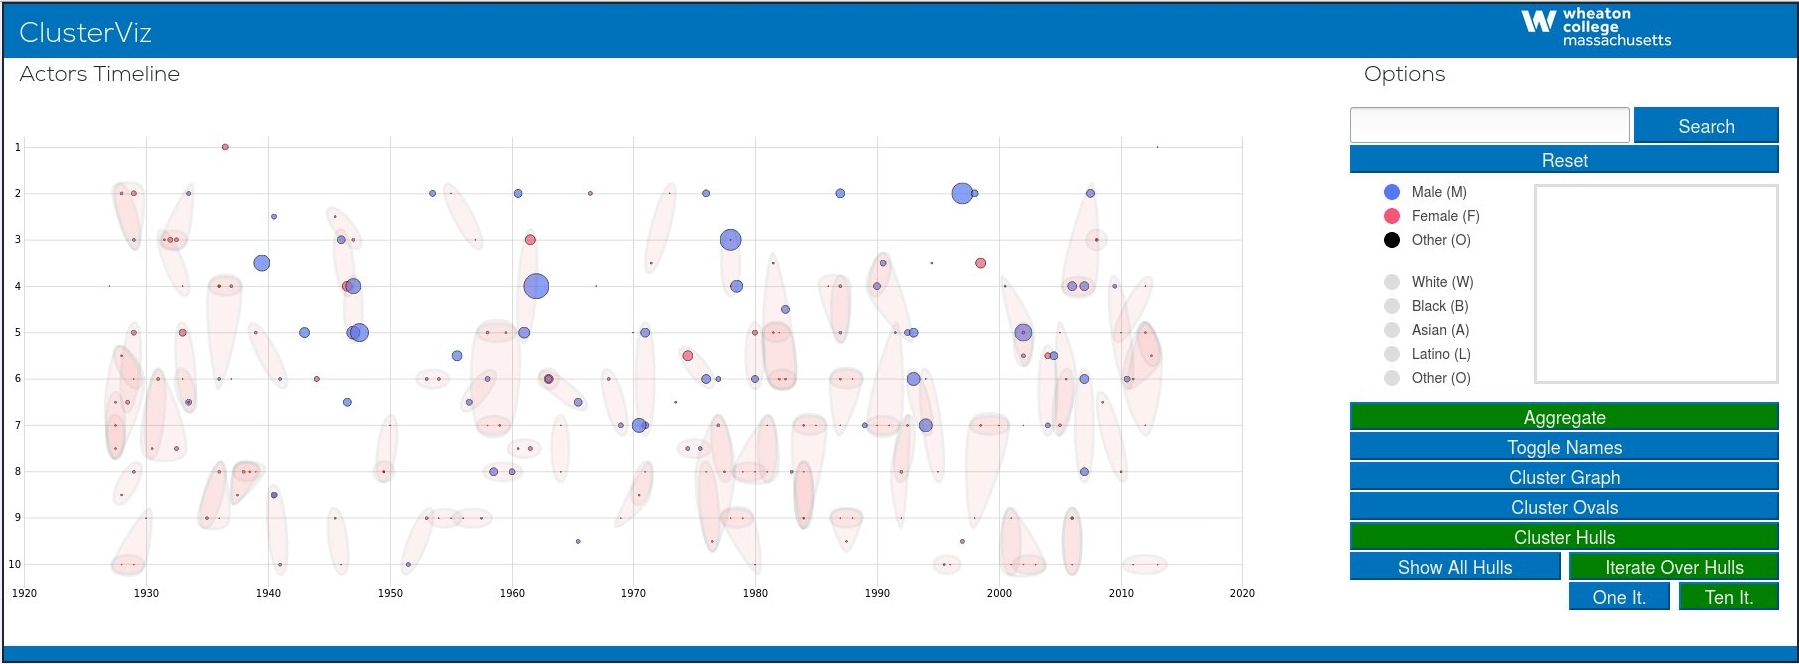
Top Ten Actors Over Time, work done in conjunction with
John Grady (Professor Emeritus, Department of
Sociology, Wheaton College).
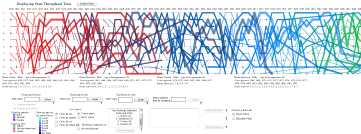
A second project, also done with John Grady, involves the visualization of Social Stratification. - DEM Error Visualization - many digital elevation models (DEMs) are constructed from less-than-perfect data, and along with the computations necessary to create the final surface, errors are inevitable. This research seeks to determine the severity of the error.
- Surface Reconstruction - creating a 3D (actually 2.5D) surface from 2D sources, such as contour lines (isolines) or other sparse data arranged on a grid. The data is interpolated or otherwise used to create a digital elevation model (DEM). A DEM is useful for visualization and analysis of a particular region. Some of this work has been done in conjunction with Wm. Randolph Franklin (retired, Electrical, Engineering, and Systems Engineering Department, Rensselaer Polytechnic Institute)
- Student Research/Projects - students are involved with a variety of research or other interesting projects, often in the summer.
Data Visualization: Top Ten Actors Over Time
This research is being done in collaboration with John Grady (Emeritus) of Wheaton College's Department of Sociology; much of the implementation of the original visualization using Flash was done by Melissa Branagan '14. Refactoring to CSS, Javascript, and D3 was begun by Grace Ulinski '17, Zevi Rubin '16, and Kamran Noorian '17. Work is ongoing on this project.
Movie stars represent a persona - a model social type - that captures the public's imagination and embodies their desires and dreams for a short period of time and, in some cases, much longer. It seems that this symbolic space is limited to only a few stars that the viewing public can adore at any one given time. In this visualization project, we hope to find these ''alpha stars" and their interconnections. We also hope to find patterns concerning race/ethnicity, gender, and so forth. We are working to make this web-based tool more general so as to work with other top ten data sets, such as baseball batting averages, to name just one example.
Click on an image to run one of the prototype visualizations:
- 2020
- 2016
Note that all of the Flash versions are now dead.
Relevant Publications/Presentations
- Grady, J. and Gousie, M. The Social Composition of an Imaginary World: The Star Village in Hollywood, 1927-2013. Presented at the International Visual Sociology Association (IVSA) Annual Conference, Tinos, Greece, June, 2015.
- Gousie, M.B., Grady, J., and Branagan, M.* Visualizing Trends and Clusters in Ranked Time-Series Data. In Visualization and Data Analysis 2014 (San Francisco, 2014), P. C. Wong, D.L. Kao, M.C. Hao, and C. Chen, Eds., vol. 9017, IS&T/SPIE, pp. 90710f-1 -- 90710f-12.
- Grady, J., Gousie, M., and Branagan, M.* Visualizing the Hollywood Pantheon, presented at the International Visual Sociology Association (IVSA) Annual Conference, University of London, July, 2013.
Data Visualization: Social Stratification
This research was also done in collaboration with John Grady (Emeritus) of Wheaton College's Department of Sociology. The idea is to use metaphors to create easy-to-use visualizations in order to see patterns in socio-economic data gathered from the US Census (jump to 2019 update). The Java applets allow the user to compare different social classes, ethnic background, job type, and income in a dynamic way. With the help of students, we have created web-based prototypes using three different metaphors:
- The Target
This is the original metaphor, where the center of a dart board represents the highest income level and the rings representing progressively lower levels. Each "hit" represents 160,000 individuals at that income level.Students Sarah Milewski '07 and Chris Stuetzle '07 implemented a newer applet of The Target which addressed some of the shortcomings of the original version.
- The Mountain Climber
In this metaphor, the goal is to climb to the peak of a mountain, where the highest income levels exist. The different "mountains" can be moved or stacked to more easily compare desired parameters. This is a nice improvement over The Target.This applet was implemented by Sarah Milewski '07 and Chris Stuetzle '07.
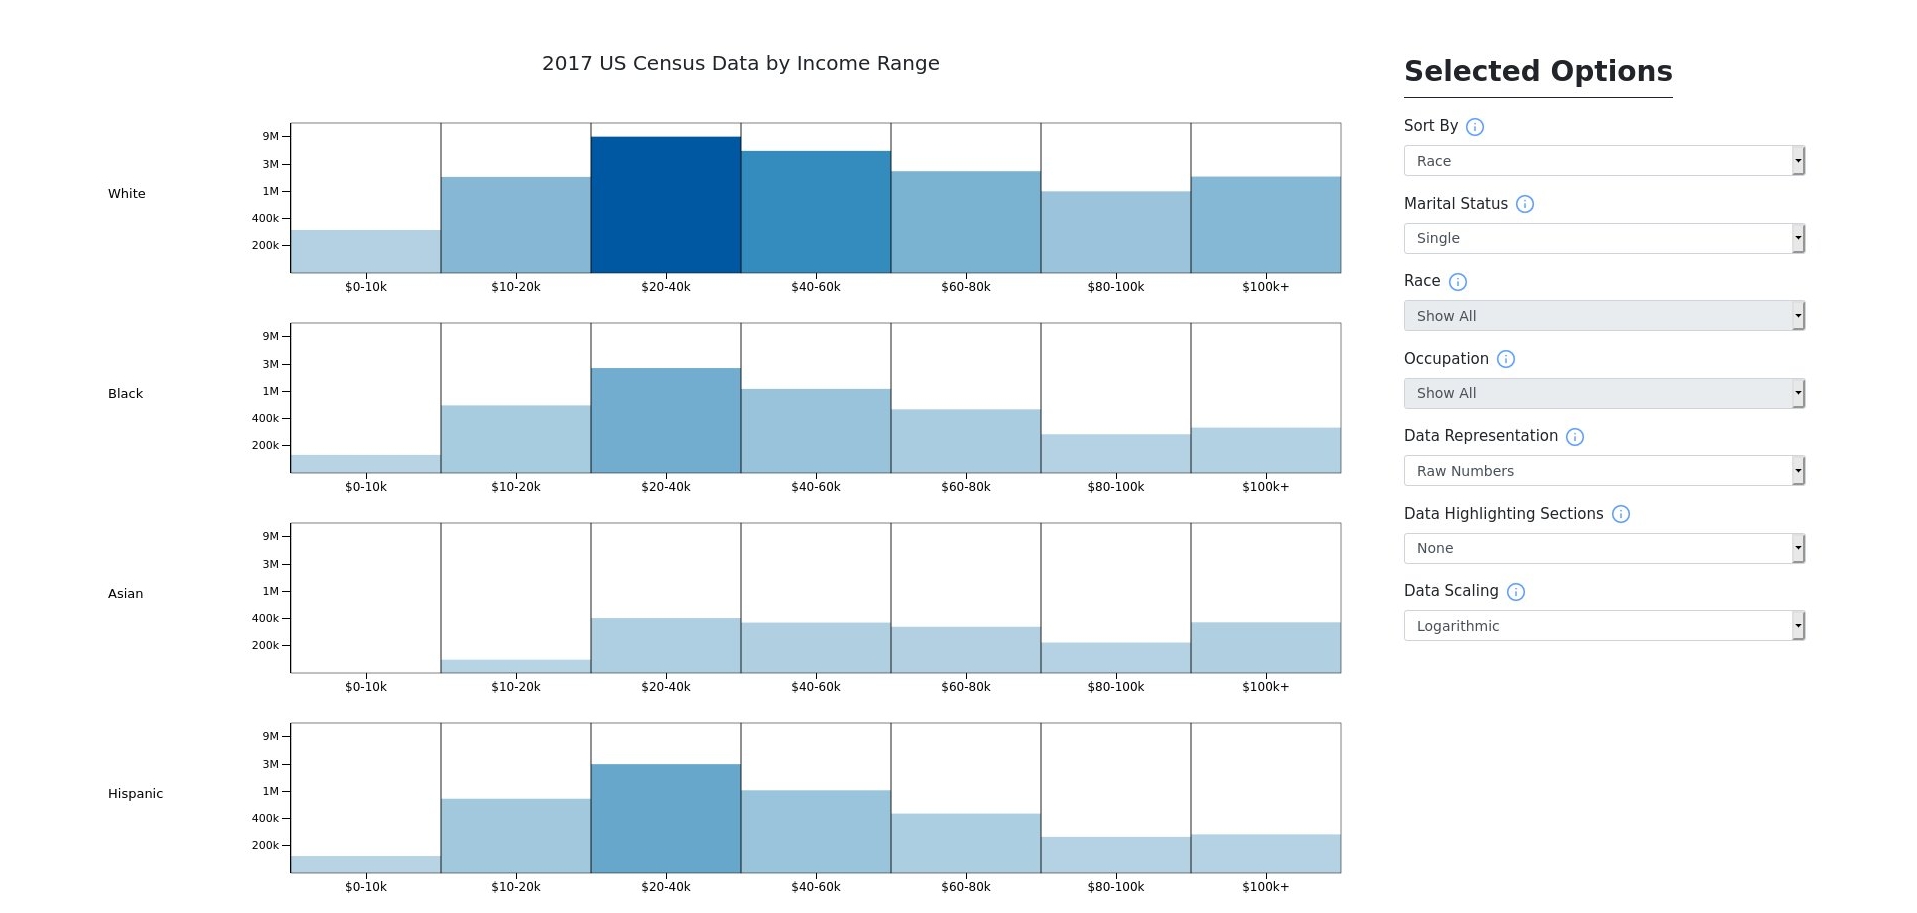
- Census2 (CensusSquared)
Students Ben Burrage, Robby Grossman, Dave Machado, all from the Class of 2007, implemented this metaphor, wherein equal-size boxes are stacked on top and next to one another so as to allow easy comparisons. The higher the income, the more a box is filled. Although this is perhaps a less-strong metaphor, the regularity of each box makes it much easier to move about and stack to produce data patterns. This implementation also has no inherent clustering effect that both The Target and Mountain Climber have, as the area gets smaller as the income level rises in both of the latter implementations.More recently, Nathan Hodges '20 updated Census2 using JavaScript and D3. He also worked on a new approach using a Zoomable Sunburst, which includes a dual-chart feature to compare to sets of variables side-by-side. Click on the image below to run Census2.
Relevant Publications/Presentations
- Gousie, M.B., Grady, J., Burrage, B.*, Grossman, R.*, Machado, D., Milewski, S.*, and Stuetzle, C.* Using Metaphors in Dynamic Social Stratification Visualizations. In IV08: 12th International Conference on Information Visualization (London, 2008), IEEE, pp. 485-490. (paper)
- Gousie, M.B. and Grady, J. Targeting Social Stratification, presented at the International Visual Sociology Association (IVSA) Annual Conference, San Francisco, August 12, 2004. (talk)
Student Research/Projects
There are many research or independent study projects available in the topics listed above but also in computer graphics and information visualization in general. Please see me to discuss your interests. You may be surprised at the opportunities available to you!
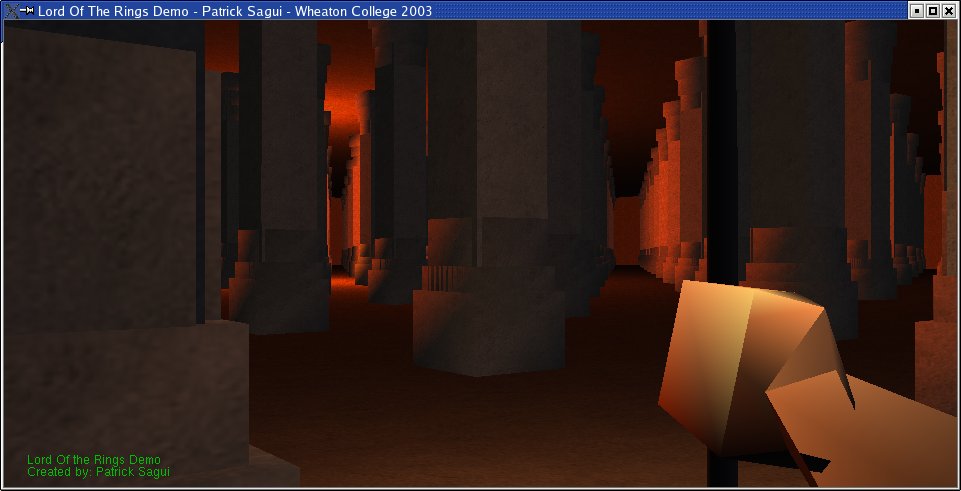
Scene from Lord of the Rings by Pat Sagui '04
Student Publications/Presentations
- Lord, H. Editing DEM Files to Represent Overhanging Structures and Arches. Poster presented at the Twenty-Sixth Annual Consortium for Computing Sciences in Colleges Northeast Conference (CCSCNE), April, 2022.
- LeBlanc, M., Littler, E., and Loberti, J. 3D Modeling to Virtual Viewing: Providing Access to Wheaton's African Collection. Poster presented at the Twenty-Third Annual Consortium for Computing Sciences in Colleges Northeast Conference (CCSCNE), April 2018.
- Ulinski, G. and Rubin, Z. Information Visualization: Top Ten Rankings over Time. Poster presented at the Twentieth Annual Consortium for Computing Sciences in Colleges Northeast Conference (CCSCNE), April 2016.
- Faulconer, N. Design and Comparison of Parallel Ray-Tracing Algorithms. Honors Thesis, Wheaton College, 2012.
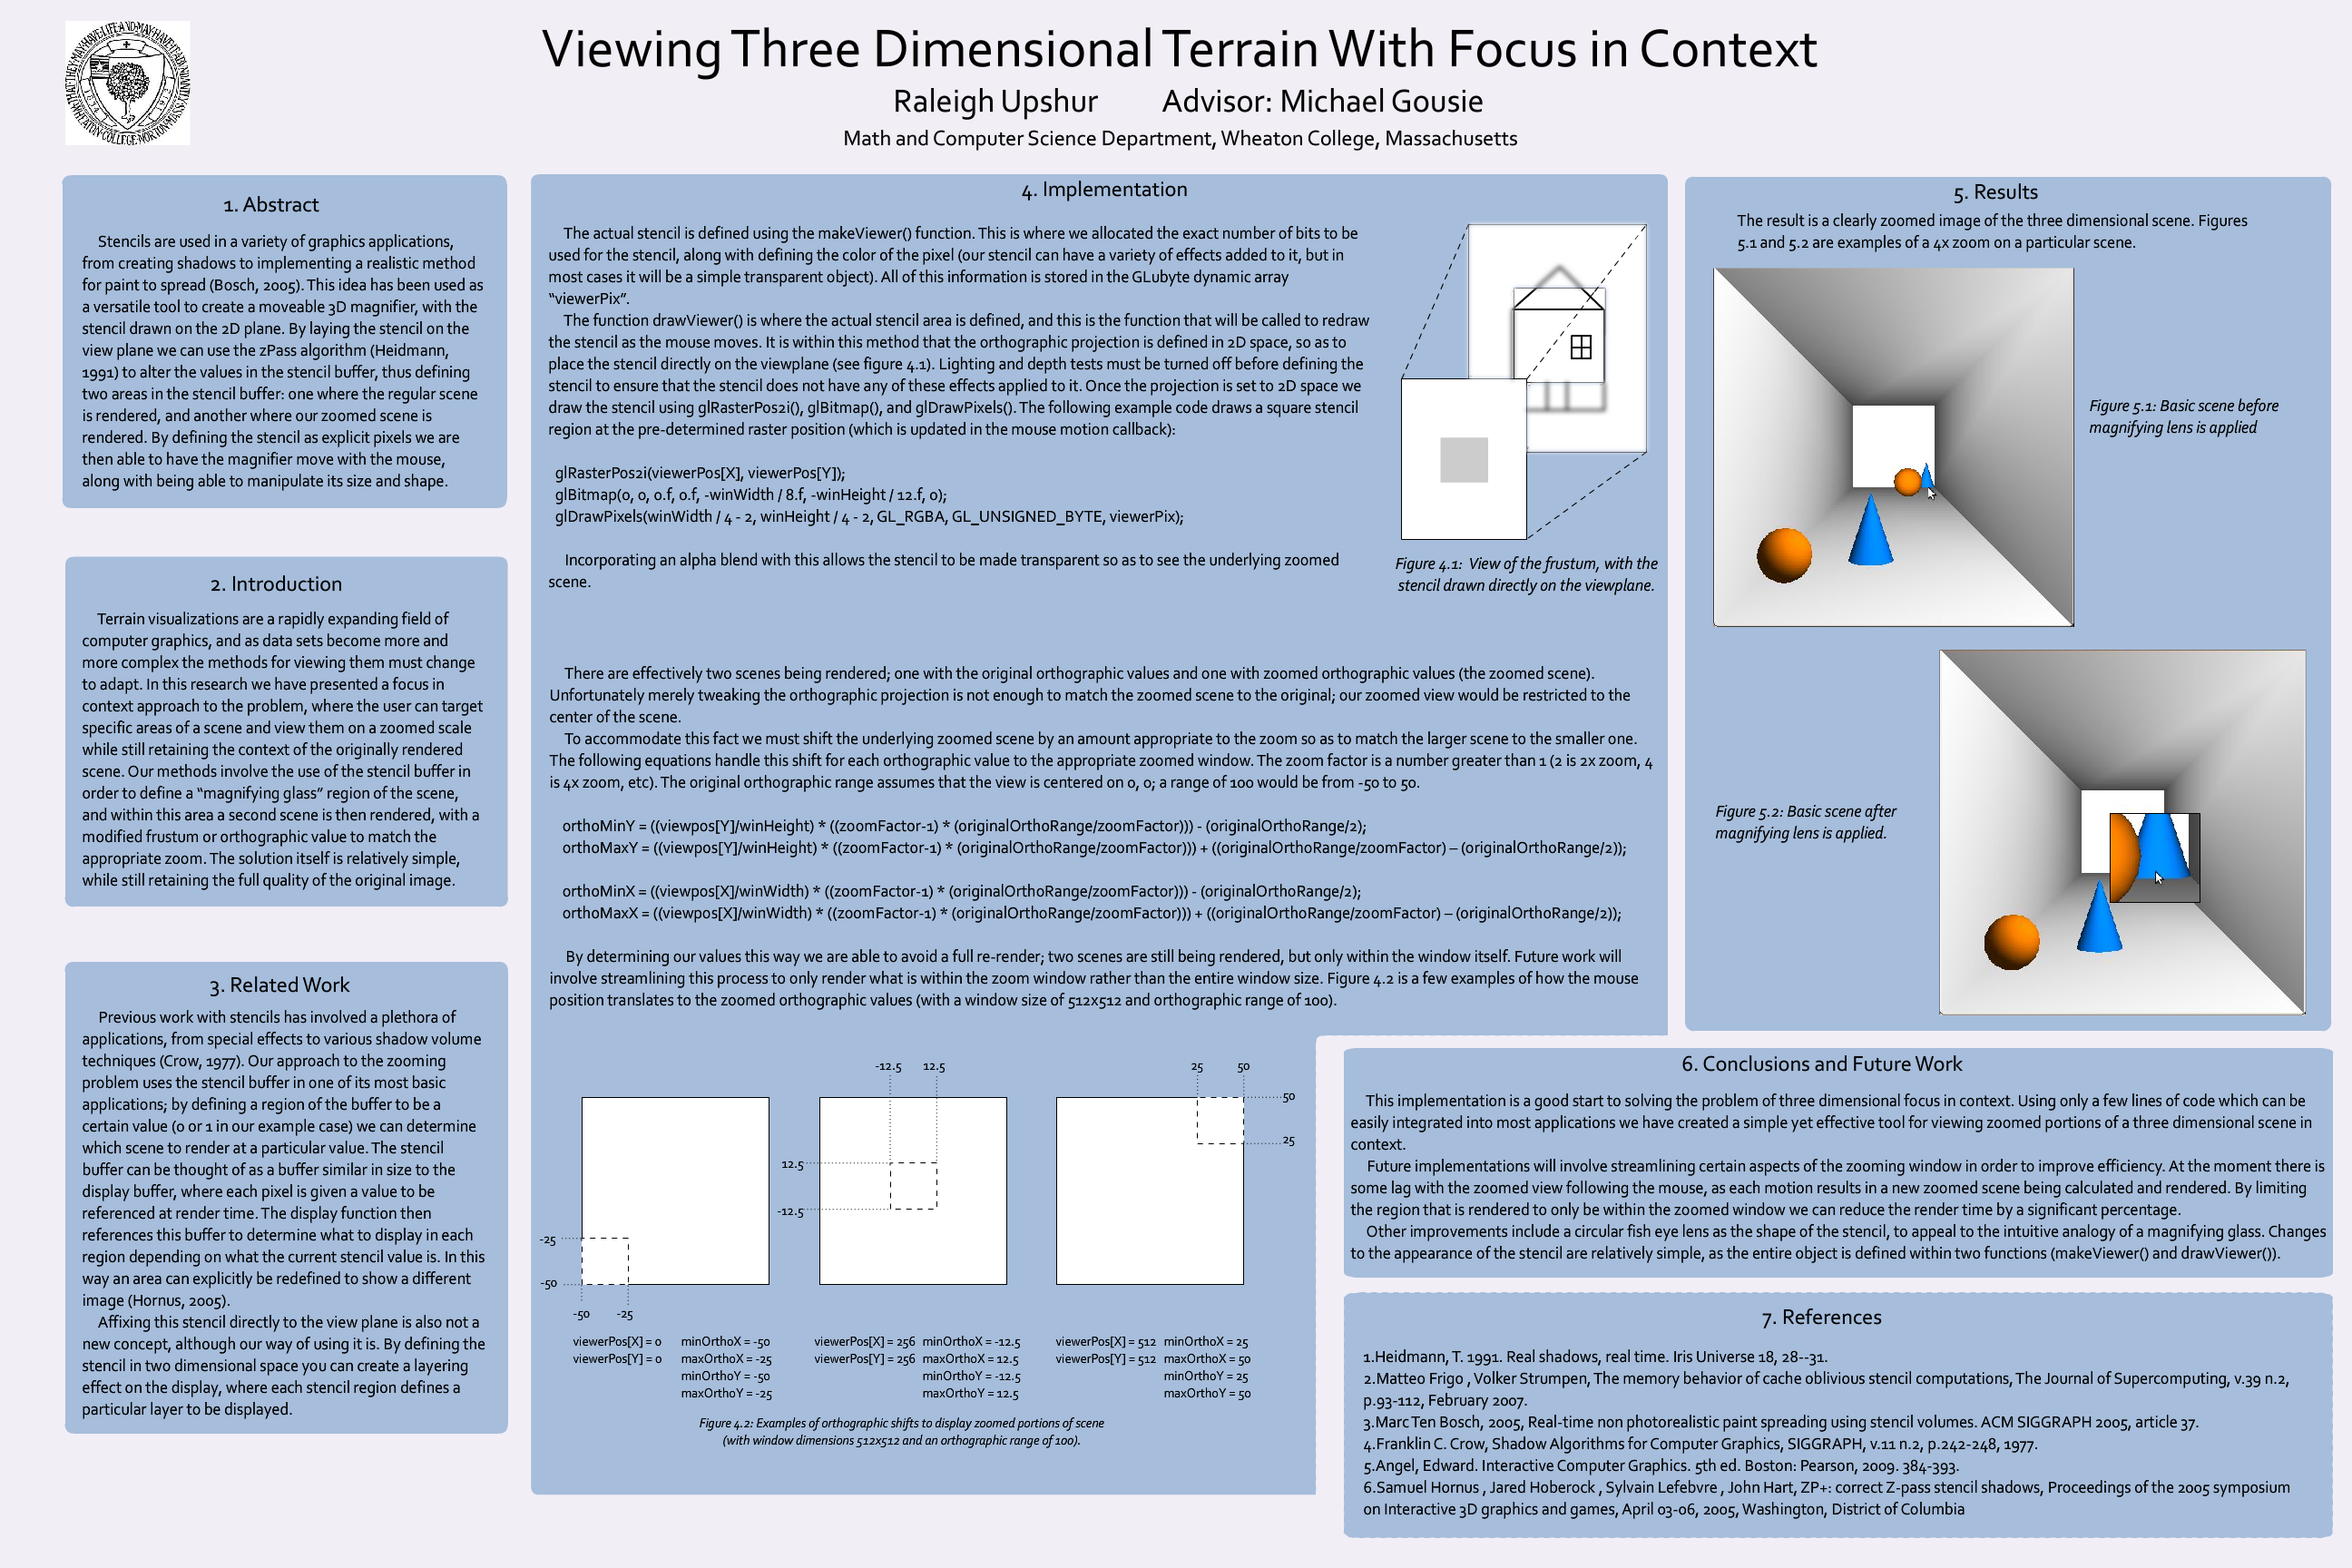
- Upshur, R. Viewing Three-Dimensional Terrain with Focus in Context. Poster presented at the Fifteenth Annual Consortium for Computing Sciences in Colleges Northeast Conference (CCSCNE), April 2010. (poster)
- Stuetzle, C. Computer Modeling and Visualization of Luminescent Crystals: The Role of Energy Transfer and Upconversion. Honors Thesis, Wheaton College, 2007. (thesis)
- Bowe, S. Error Detection and Visualization in Digital Elevation Models. In Journal of Computing Sciences in Colleges, Proceedings of the Tenth Annual CCSC Northeast Conference (2005), pp. 103-104.
- Williams, G. An Autoscheduling Optimizer for Perl. Honors Thesis, Wheaton College, 2003.
- Williams, G., Doolittle, N., and Agnitti, T. A Surface Reconstruction Research Environment. In Journal of Computing in Small Colleges, Proceedings of the Seventh Annual CCSC Northeast Conference (2002), pp. 301-302.
Data Visualization: Clustering and Visualizing COVID-19 Data (CoronaViz)
This system grew out of the Top Ten Actors visualization. Instead of individual actors as data points, US states and the total number of COVID-19 deaths and cases are plotted. The application was modified to use this data, and is continually being updated. Click on the image below to run the application, which has data up through June 8, 2020. The application was being rewritten to be more robust by Javier Esteban '21.
DEM and Error Visualization
Traditional geographic information systems (GIS) have many capabilities to compute DEM error and/or uncertainty, but they require the user to go through many complex steps. Often the result is simply a number or a 2D visualization. This research seeks to make the process much easier and faster, as well as produce a better error visualization.
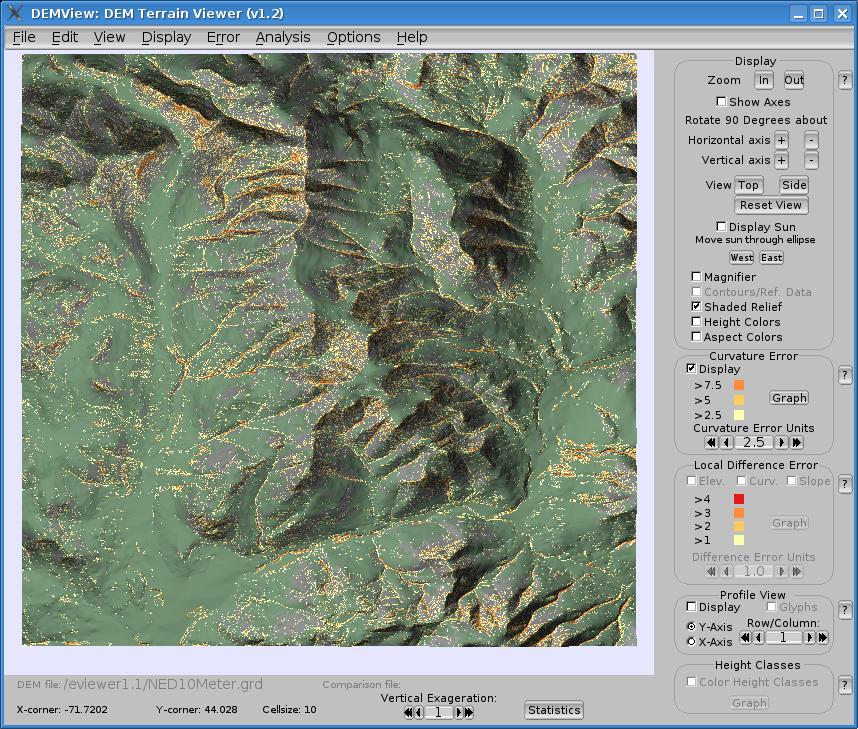 The current system, DEMView (formerly DEMEV), is shown at right, displaying a DEM
of Franconia, NH. The system includes visualizations for relief, raster height colors,
slope, height classes, curvature error, local elevation difference error, and local
curvature difference error. A vertical profile cutter allows the user to
view a desired profile of two surfaces simultaneously within the context of the
3D surface visualization.
The current system, DEMView (formerly DEMEV), is shown at right, displaying a DEM
of Franconia, NH. The system includes visualizations for relief, raster height colors,
slope, height classes, curvature error, local elevation difference error, and local
curvature difference error. A vertical profile cutter allows the user to
view a desired profile of two surfaces simultaneously within the context of the
3D surface visualization.
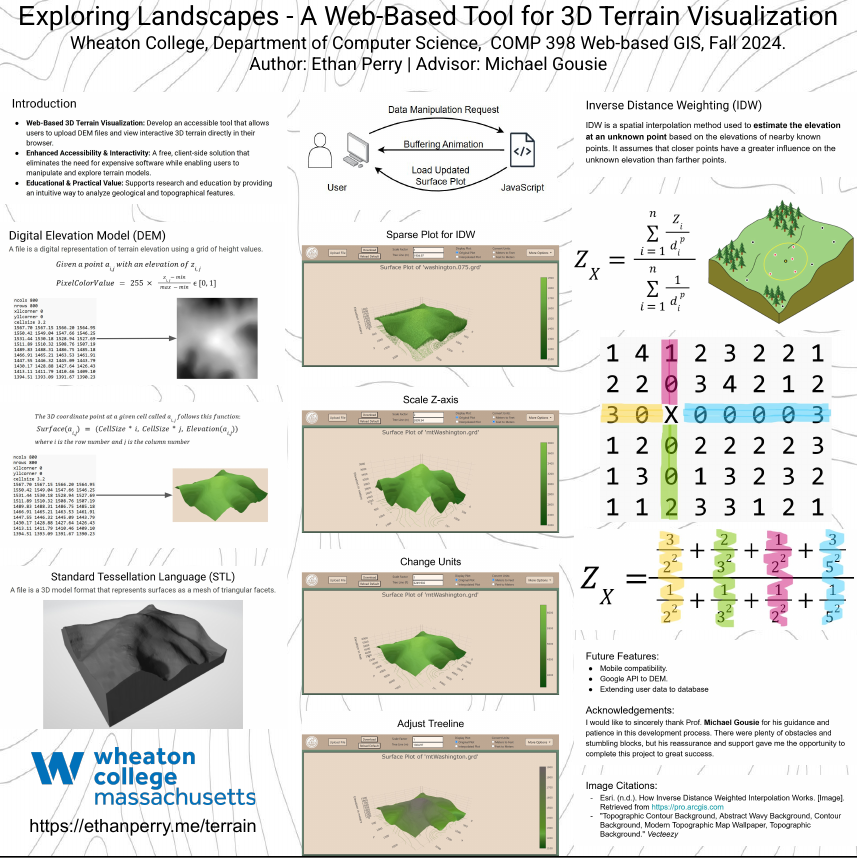
Ethan Perry '25 created a web page that allows a user to view and
manipulate terrain stored in DEM format. His poster is shown below:
Relevant Publications/Presentations
- Gousie, M.B. The Case for 3D Visualization in DEM Assessment. In Advances in Spatial Data Handling: Geospatial Dynamics, Geosimulation and Exploratory Visualization, S. Timpf and P. Laube, Eds., Advances in Geographic Information Science, Springer, 2013, pp. 27-43.
- Gousie, M.B. Focus + Context for Visualizing Uncertainty in DEMs. Poster presented at the IEEE Information Visualization Conference, 2011. (poster)
- Gousie, M.B., and Smith, M.J. DEMView: 3D Visualization of DEM Error. In Accuracy 2010, Proceedings of the Ninth International Symposium on Spatial Accuracy Assessment in Natural Resources and Environmental Sciences (Leicester, UK, July 2010), N.J. Tate and P.F. Fisher, Eds., ISARA, pp. 165-168. (slides, paper)
-
Gousie, M. B. and Milewski, S.*
A System for 3D Error Visualization and Assessment of
Digital Elevation Models. In Proceedings of the 2007
IEEE International Geoscience and Remote Sensing
Symposium (IGARSS '07) (Barcelona, 2007),
pp. 4064-4067.
(paper)
- Gousie, M. B. Digital Elevation Model Error Detection and Visualization. In The 4th Workshop on Dynamic & Multi-dimensional GIS (Pontypridd, Wales, UK, 2005), C. Gold, Ed., ISPRS, pp. 42-46. (paper)
- Gousie, M. B., Williams, G.*, Agnitti, T.*, and Doolittle, N.* CompSurf: An Environment for Exploring Surface Reconstruction Methods on a Grid. Computers & Geosciences 29, 9 (2003), 1165-1173. (paper)
Surface Reconstruction Algorithms
In this research, we begin with digitized contour maps, like the one shown below
depicting Mt. Washington, NH:
 From this sparse data set, a full DEM is computed by interpolation and/or approximation
methods while preserving the accuracy of the surface defined by the data.
An example of a DEM derived by our Intermediate Contour Method is shown below (red=high elevation,
blue=low):
From this sparse data set, a full DEM is computed by interpolation and/or approximation
methods while preserving the accuracy of the surface defined by the data.
An example of a DEM derived by our Intermediate Contour Method is shown below (red=high elevation,
blue=low):
 Surface Reconstruction Animation
Another method for creating a DEM is by simulating a thin plate being draped over the sparse data points to create a surface. It takes many iterations of the thin plate method to completely fill in a regular grid of elevation points. This animation shows how a sample contour map is filled in with a thin plate approximation after intermediate contours are computed.
A more recent research direction focuses on updating the DEM
format to be able to store multiple elevation values at a particular
latitude/longitude point. This enables the representation of arches,
caves, and general overhanging terrain structures. Hannah Lord '22 worked
on this and presented a poster at a regional conference, as shown
below:
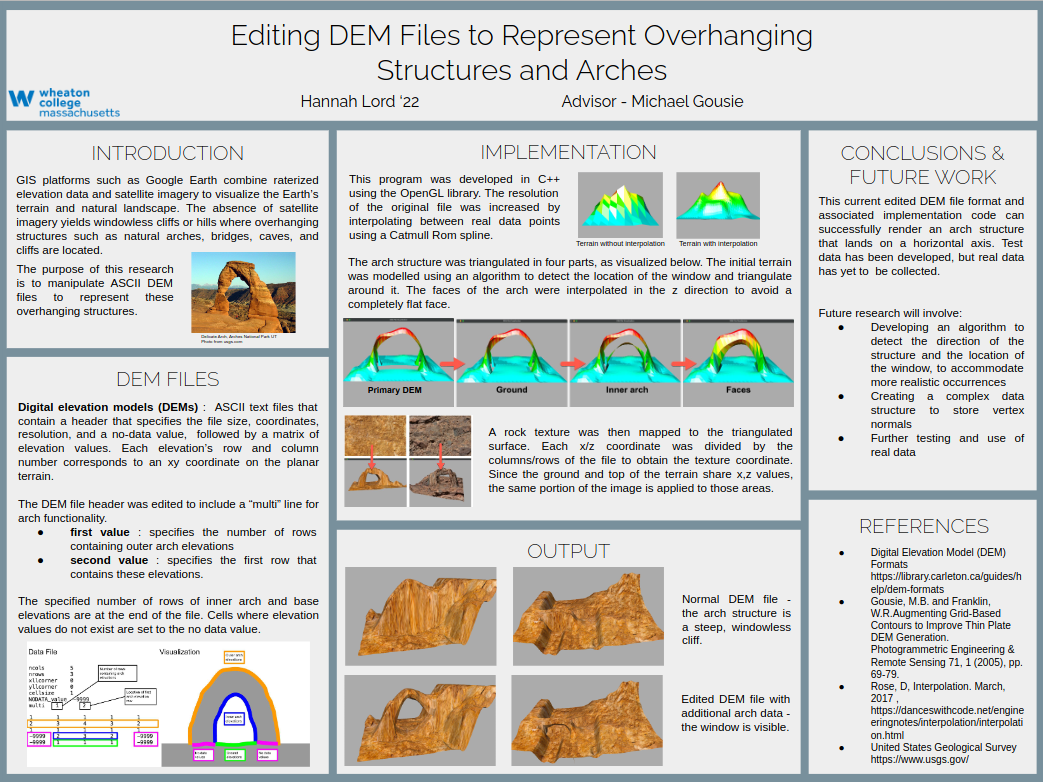 Hannah's work contributed much to a paper presented at IGARSS '23.
Relevant Publications/Presentations
- Gousie, M.B. and Lord, H*. A Modified DEM for Representing Overhanging Terrain. In Proceedings of the 2023 IEEE International Geoscience and Remote Sensing Symposium (IGARSS '23) (Pasadena, 2023).
- Smith, M.J., Rose, J., and Gousie, M.B. The Cookie Cutter: A Method for Obtaining a Quantitative 3D Description of Glacial Bedforms. Geomorphology 108 (July 2009), 209-218.
- Smith, M.J., Rose, J., and Gousie, M.B. A Method of Quantifying Subglacial Sediment Transport/Deformation. Poster presented at Geomorphology & Earth System Science, BGRG International Conference, Loughborough, UK, June 2006. (poster)
- Gousie, M. B. and Franklin, W. R. Augmenting Grid-Based Contours to Improve Thin Plate DEM Generation. Photogrammetric Engineering & Remote Sensing 71, 1 (2005), pp. 69-79. (paper)
- Gousie, M. B. and Franklin, W. R. Constructing a DEM from Grid-based Data by Computing Intermediate Contours. In GIS 2003: Proceedings of the Eleventh ACM International Symposium on Advances in Geographic Information Systems (New Orleans, 2003), E. Hoel and P. Rigaux, Eds., pp. 71-77. (paper)
- Franklin, R and Gousie, M. Terrain Elevation Data Structure Operations. In 19th International Cartographic Conference & 11th General Assembly of the International Cartographic Association (ICA) (Ottawa, 1999). (paper)
- Gousie, M and Franklin, R. Converting Elevation Contours to a Grid. In Proceedings, Eighth International Symposium on Spatial Data Handling (1998), T. Poiker and N. Chrisman, Eds., pp. 647-656. (paper)
- Gousie, M. B. Contours to Digital Elevation Models: Grid-Based Surface Reconstruction Methods. PhD thesis, Rensselaer Polytechnic Institute, 1998. (thesis)
Modeling Three-Dimensional Artwork
In this student-oriented project, we are modeling sculptures and other artwork from Wheaton's African Collection. These true 3D models can then be viewed on a web page or using virtual reality (VR) equipment.

3D model of The Tree of Life, from Wheaton's African Collection
Relevant Publications/Presentations
- Boylan, K., Gousie, M., and Niederstadt, L. "Modeling and Viewing Three-Dimensional Artwork," presented at Digital Commonwealth's 13th Annual Conference, The College of the Holy Cross, Worcester, MA, April 9, 2019.
* indicates Wheaton College student author.
Last updated