Ranking Timeline data visualization - Wheaton College Computer Science
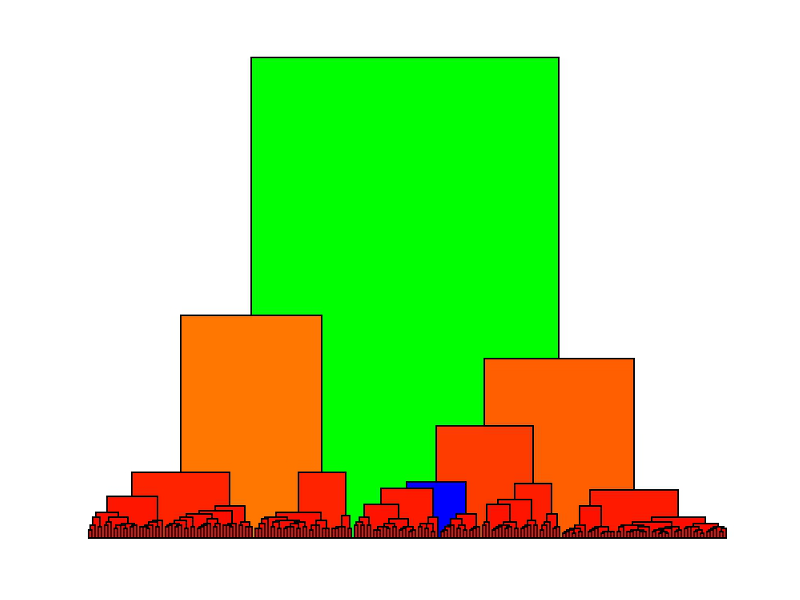
The Ranking Timeline is a visualization of ranked, time-series data. Currently, we are investigating the top ten movie stars in each year over time. Movie stars represent a persona - a model social type - that captures the public's imagination and embodies their desires and dreams for a short period of time and, in some cases, much longer. It seems that this symbolic space is limited to only a few stars that the viewing public can adore at any one given time. In this visualization project, we hope to find these ''alpha stars" and their interconnections. We also hope to find patterns concerning race/ethnicity, gender, and so forth.
We are now working to make this web-based tool more general so as to create visualizations any top ten data sets, such as baseball batting averages, to name just one example.
This research is being done in collaboration with John Grady of Wheaton College's Department of Sociology; much of the original implementation of the visualization was done by Melissa Branagan '14.


Developers
- Dr. Michael Gousie, Dept. of Math & Computer Science
- Dr. John Grady, Dept. of Sociology
- Melissa Branagan '14
- Grace Ulinski '17
- Zevi Rubin '16
- Kamran Noorian '17
Publications
- Gousie, M.B., Grady, J., and Branagan, M. Visualizing Trends and Clusters in Ranked Time-Series Data. In Visualization and Data Analysis 2014 (San Francisco, 2014), P. C. Wong, D.L. Kao, M.C. Hao, and C. Chen, Eds., vol. 9017, IS&T/SPIE, pp. 90710f-1 -- 90710f-12.
- Grady, J., Gousie, M., and Branagan, M. Visualizing the Hollywood Pantheon, presented at the International Visual Sociology Association (IVSA) Annual Conference, University of London, July, 2013.